Projects
Power BI Report: Sales & Production Insights for Aikeen Industries (2019–2022)
This interactive Power BI report was developed to provide actionable insights into sales and production trends at Aikeen Industries from 2019 to 2022. It empowers stakeholders with data-driven answers to key business questions and supports strategic decision-making. Key analyses include:
-
Sales Team Performance: Comparison of Sales Forecasts against Production Forecasts to evaluate forecast alignment and team effectiveness.
-
Forecast Accuracy & Inefficiencies: Evaluation of Actual Production vs. Production Forecast to highlight areas of overproduction or shortfall.
-
Forecast Reliability by Product: Identification of products with high forecast inaccuracies based on historical performance.
-
Order Shortages: Analysis of Sales Orders vs. Finished Goods Inventory to identify fulfillment gaps.
-
Sell-Through Rate: Calculation of sell-through rate using the formula:
Sell-through Rate = (Units Sold / Units Produced) -
Inventory Utilization: Detection of items in Finished Goods Inventory with low or no sales to optimize stock management.
-
Fill Rate Analysis: Measurement of the fill rate to assess order fulfillment efficiency.
-
2022 Forecast Outlook: Projection of the remaining 2022 forecast using trends in Actual Production vs. Production Forecast.
This report highlights critical areas for improvement while providing a comprehensive view of operational efficiency across the organization.
A dummy version of the report can be found here

Sales Performance Dashboard for Tacoma Sales Group
Tacoma Sales needed a consolidated, daily-updated report to track sales and performance across four warehouses, with personalized views for each Warehouse Manager.
The project was delivered in three phases:
-
Data Gathering & Preparation:
I built an ETL pipeline using Azure Data Factory to extract data from SQL Server and service APIs, apply business rules, and load it into an Azure SQL Database, creating a centralized data warehouse. -
Report Development:
Using Power BI, I modeled the data and built dynamic dashboards with DAX calculations. The report was published to the Power BI Service with automated daily refresh. -
User Experience & Delivery:
The report homepage displays a hierarchical overview from company-wide metrics down to individual warehouse performance. Each warehouse has a detailed summary page with drill-through functionality, enabling users to explore data while preserving filter context.
This solution provided Tacoma with real-time visibility into warehouse performance, helping drive data-informed decisions and boost revenue.
A dummy version of the report can be accessed here

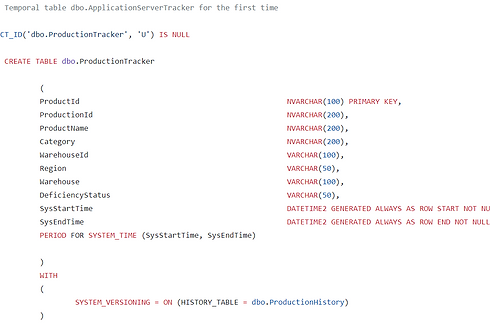
Implementing SCD Type 2 with Temporal tables in SQL server using Stored procedures
The challenge: the source database was refreshed daily without incremental logic, wiping previous records and retaining no historical data—making trend analysis impossible.
To solve this, I implemented a Slowly Changing Dimension Type 2 (SCD Type 2) strategy using SQL Server’s Temporal Table feature combined with the MERGE function. A stored procedure was developed to load data into the historical table, capturing changes by inserting new records when defined parameters were updated. This approach preserved historical states and enabled accurate tracking of production deficiency trends over time.
The final report was built in Power BI, with DAX used for trend calculations and visual storytelling, giving stakeholders the ability to monitor and analyze production performance over time.
The link to the sample code which is a dummy version of the original can be found here.
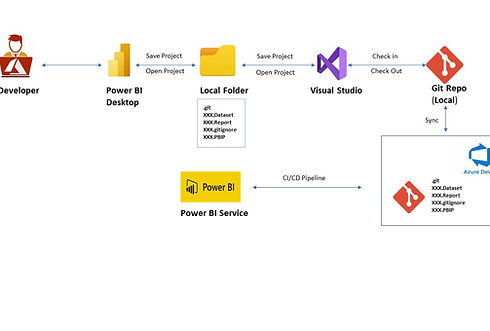
Implementing Version Control and Automating the Deployment of Power BI Project Files Using Git Repos and Azure DevOps CI/CD Pipeline
eam collaboration in Power BI content development and version controlling is one of the key features that was missing in Power BI Desktop. But not anymore, Microsoft lately released the public preview of Power BI Desktop Developer Mode, which enables multiple individuals to work together seamlessly on the same Power BI project and keep version control.
More interestingly, we can also automate the deployment of the Power BI project files (.PBIP) to Power BI Service workspace using Azure DevOps CI/CD pipeline.
This was a capability my organization needed in order to automate all processes and allow for collaboration among Power BI Developers.
I achieved this by integrating Power BI Desktop Project Files with Git Repos on Azure DevOps using Visual Studio Code. Changes made to the reports on Power BI desktop are synced with the repos on Azure DevOps with the descriptive Commit Message that enable other developers to understand changes that has been made to the report over time and these changes can be easily reversed from the repos
Stock Portfolio Analysis Dashboard
This report shows important metrics about Stocks listed on the AAPL Exchange; this was done for an investment banker. The report refreshes daily as the data are collected via APIs and are through ETL pipelines loaded into a SQL Server Data Warehouse. The Power BI then consumes the report from the data warehouse via import mode and refreshes on a daily basis. The report can be accessed here

Call Center Performance Analysis
The call center insights analysis is a performance report that showcase the performance of the call centers as a whole and have a detailed page that drill down to individual call agents, this detail page shows key metrics to assess the performance of each agent and understand how they contribute to the overall success of the call centers. This was done to see how to proper optimize the call center for effective performance and ensure overall customer satisfaction thereby improving the bottom-line of the business. The report can be accessed here.
